
Crisis Risk Dashboard - Product - Tableau
This is Part II of a two-part post. Part I outlines the process of presenting the data using Tableau and Part II delves into insights...
Sep 7, 2018


Crisis Risk Dashboard - Process - Tableau
This is Part I of a two-part post. Part I outlines the process of presenting the data using Tableau and Part II delves into insights from...
Sep 1, 2018


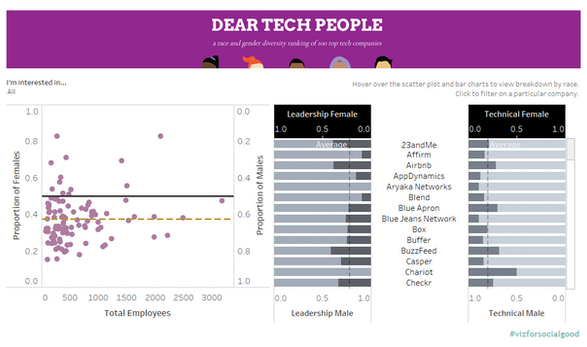
Dear Tech People - Product - Tableau
This is Part II of a two-part post. Part I outlines the process of presenting the data using Tableau and Part II delves into insights...
May 10, 2018


Dear Tech People - Process - Tableau
This is Part I of a two-part post. Part I outlines the process of presenting the data using Tableau and Part II delves into insights from...
May 9, 2018


Vulnerable Groups in Palestine - Product - Tableau
This is Part II of a two-part post. Part I outlines the process of presenting the data using Tableau and Part II delves into insights...
Apr 12, 2018


Vulnerable Groups in Palestine - Process - Tableau
This is Part I of a two-part post. Part I outlines the process of presenting the data using Tableau and Part II delves into insights from...
Apr 8, 2018


Pollicy - Product - Tableau
This is Part II of a two-part post. Part I outlines the process of presenting the data using Tableau and Part II delves into insights...
Mar 18, 2018


Pollicy - Process - Tableau
This is Part I of a two-part post. Part I outlines the process of presenting the data using Tableau and Part II delves into insights from...
Mar 12, 2018


Homelessness in the UK - Product - Tableau
This is Part II of a two-part post. Part I outlines the process of presenting the data using Tableau and Part II delves into insights...
Feb 14, 2018


Homelessness in the UK - Process - Tableau
This is Part I of a two-part post. Part I outlines the process of presenting the data using Tableau and Part II delves into insights from...
Jan 20, 2018


